We Transform Your Vision into Creative Results
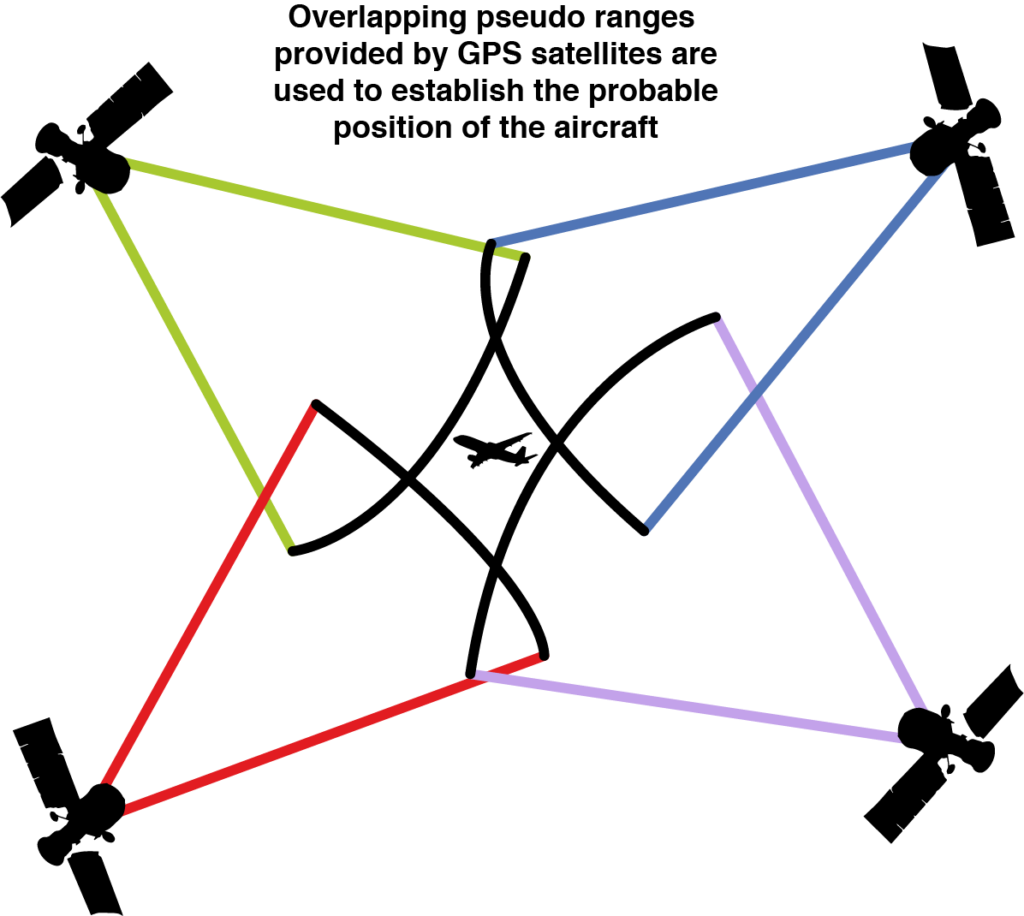
The fundamental concept of the process is to use triangulation, similar to that used by satellites for navigation, to look at, in and around a sector, using robust and recognised data sources, including unusual sources such as recruitment and investment information (some in the public domain, some not) which are then used to calculate new values for sales, exports, number of companies, employees and over 65 other metrics. This process is described and demonstrated in detailed methodology documents for various sectors including security, low carbon, green economy, digital media, construction, healthcare, climate services etc. and, despite the innovative nature of the methodology, was awarded UK statistical status in 2013. Analysts from Greater London Authority have assessed the process and data and approve its use.
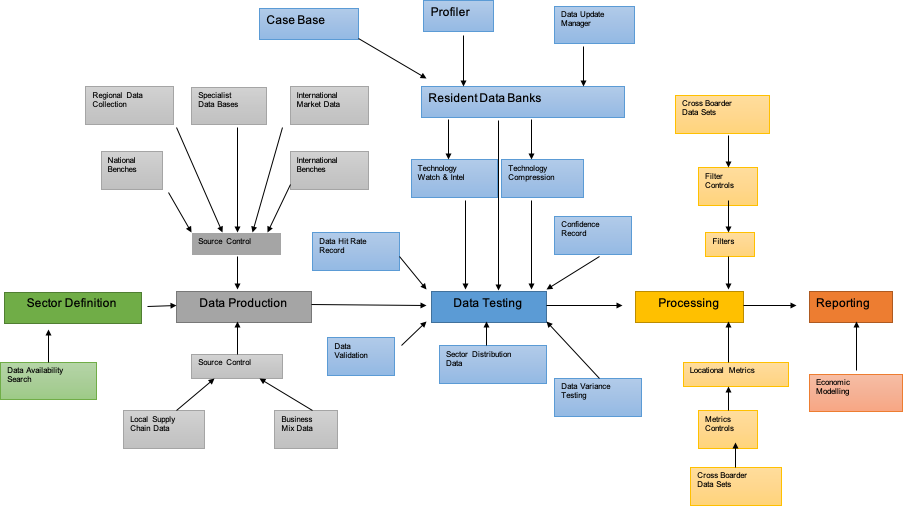
The flow chart in figure 1 gives an outline of the kMatrix profiling system, the same basic process is used, with slight variance depending on whether it is a full sector being mapped, or a single technology being mapped through a supply chain. Some sectors are easier to map than others, for example, Climate Services is an emerging sector, albeit using existing competencies, which is difficult to measure, with sparse data sources available. In contrast, construction is a well-established sector, with a wide range of high quality and robust data sources. Sources selected varies, with never less than 7 sources used per data value.


